Last Updated on February 27, 2024
Infographics are, simply put, visual representations of data. They serve the purpose of clarifying and communicating complex ideas through a widely accessible medium. A well-designed infographic is an incredibly effective way to distill the concepts of a highly-specialized field—computer science, math, statistics, biology—into a form that can be understood by almost anyone.
Infographics are a big part of the current world of graphic design and are growing in popularity across the web. But they are not a new concept—in fact, infographics have been an important part of visual culture for most of human history.
Historical Examples
People have been using pictures to represent ideas for millennia, and the most effective attempts have become important artifacts of the collective human heritage.
- Cave paintings, like the 25,000-year-old horses and other animals covering the walls of the famous Chauvet site in southern France, represent some of the most ancient and primitive examples of information graphics.
- Maps are a type of infographic. Some of the oldest, from the Çatalhöyük site in modern Turkey, date back as far as 7500 BCE—long before the advent of writing.
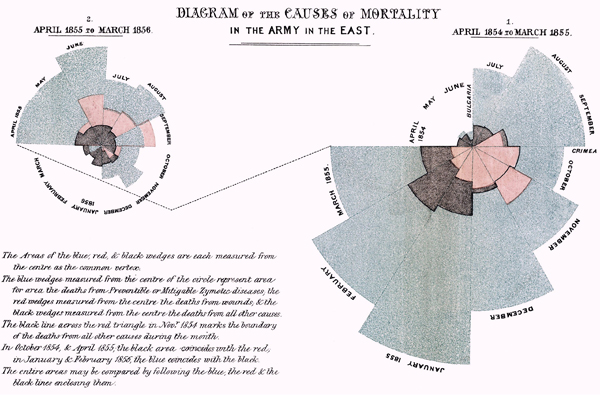
- In the early modern era scientists used charts and graphics to present their findings. The famous English nurse Florence Nightingale created a series of charts with which she successfully spurred reforms in military hospitals in her home country:
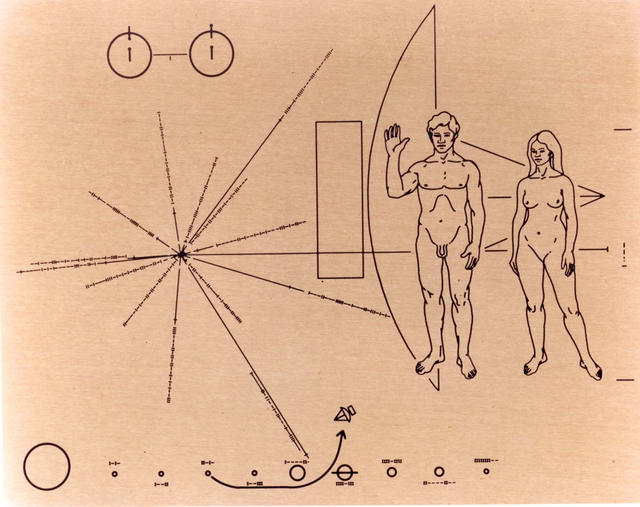
- The Pioneer Plaque was perhaps the first example of an infographic intended to be understood by non-human beings. Designed by astronomers Carl Sagan and Frank Drake, it was launched into space with the Pioneer 10 probe in 1972:

In the Current Information Age

Nowadays, advertisers and graphic designers across a wide spectrum of industries use infographics to convey all sorts of information. Most are distributed and displayed via the Internet, and many sites exist which compile the best of the best.
Cool Infographics is a blog that collects and showcases a huge variety of the best-designed infographics. The site allows visitors to search a database using keywords, allowing interested parties to find inspirational examples in any field.
Visual.ly is a site that functions not only as a showcase for information graphics but also as an online community for the people who produce them. It provides users with the ability to share their creations and swap feedback, and is currently developing a set of tools that will let anyone design their own infographics. The site is closely associated with many large media companies like the Huffington Post and Showtime and its infographics have been featured in a variety of big-name publications and networks like CNN.
HistoryShots is a site with a much narrower focus. As its homepage proudly declares: “We create elegant graphics and diagrammatic art that visually tell stories about subjects, time periods and events. Our work has won numerous design awards and is frequently cited in books, magazines, and on the web.” HistoryShots is a great example of what is perhaps the greatest strength of infographics in general: the capacity to convert a large amount of difficult, specific knowledge into a single form that is comprehensible and compelling to a wide audience.
Daily Infographic is a great site to bookmark and check regularly if you want to keep up with the best pieces of data visualization on the web. The team searches exhaustively for the finest, best-crafted examples available and posts a new one each day.
Infographics are instruments of immense communicative paper—in the current information-driven age, their importance is not to be ignored. The field of data visualization is evolving and expanding at a rapid pace, driven by newer and better technologies and avenues of communication. But even these explosive recent developments represent the culmination of a legacy as old as humanity itself.
Check out some of our previous articles:
- Inspiration for Valentine’s Day [INFOGRAPHIC]
- To Build or Not To Build A Website [INFOGRAPHIC]
- 55 Striking Data Visualization and Infographic Poster Designs
- 30 Amazingly Creative Examples of Designer Resumes
Did you enjoy this article? Would be great to hear your feedback, so feel free to comment below. Please don’t forget to subscribe to our RSS-feed or follow Inspirationfeed on Twitter, Google+ and Facebook! If you enjoyed the following article we humbly ask you to comment, and help us spread the word!


