
Last Updated on February 28, 2024
In today’s business world, the abundance of data and information is overwhelming.
With technology progress and the data-warehousing prices collapsing, gathering and storing a humongous amount of data – big data – is becoming common.
Thanks to this massive amount of data available, companies are becoming more information-driven, basing their strategies, measuring their efforts and showing their results resting on this data.
Keeping track of sales growth, customer retention, marketing ROI, history of online orders and return, users demographics – countless metrics are helping in the matter.
However, most of that remains unstructured, or is just accumulated in static and silent spreadsheets that is of no use to anyone.
To make the most out of it though, there is a simple solution: visualization.
Why, how, and where?
Let’s go over the 4 reasons why you need data visualization in your everyday business operations!
1. We Understand Visuals Better
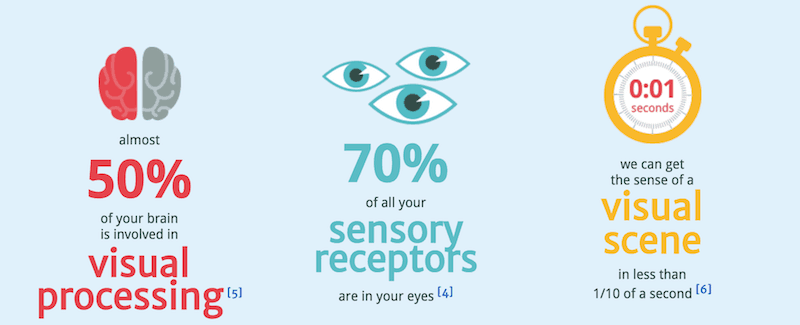
It is no surprise that visuals are attractive to everyone; what you should know though, is why they are so attractive, but also so efficient. Half of our brain is dedicated to the visual function, and 90% of the information transferred to it is purely visual. It processes images 60,000 times faster than text, which makes it always preferring graphs and drawings over numbers and endless tables.
This purely physical evidence should draw you out of boring spreadsheets and jump on online data visualization tools. Indeed, today’s managers are asked to be “data-driven” and to make informed decisions: more and more businesses are equipping themselves with these tools that help greatly in the management and visualization of data, as they do not require unique sharp IT skills to work with them. They relieve businesses from time-consuming data mining and examination, provide an enhanced customer experience and bring many other benefits.
2. You Can Spot Patterns And Relationships
Data visualization is extremely good when you work with a big amount of data: a table doesn’t let you spot easily trends and patterns between various variables for instance. Besides, with a dashboard, you can identify relationships between operations and performance.
Seeing how a marketing campaign impacts the sales, that later impact the overall performance is a powerful thing; all the more when you have to answer to your CEO or to stakeholders. Such dashboards will also help in convincing potential investors that your efforts are bringing results.
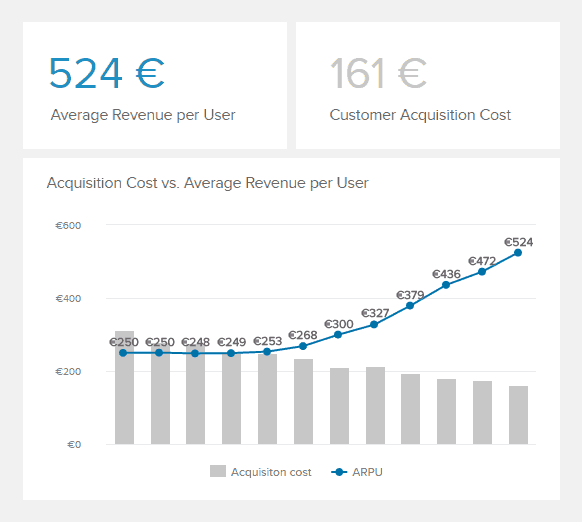
For instance, you can compare the acquisition cost to the average revenue per user over time, and see the incredible progress of your performance – the cost is on the decrease, while the revenue generated keeps on growing: you are doing a good job.
You can also take a step back and compare past and current performance, to plan for the future. Dataviz also lets you discover trends faster in consumer behavior or market conditions for instance. That’s a gem to anticipate their needs better, but also to stay ahead of the competition.
Data visualization can also help you get back on track. If a value is off trend, it will be easy to point it out and question it. What happened at this moment in time and what are the other factors involved? How are the other values behaving in comparison? It gives more room for direct action, to recalibrate a flawing strategy, or to address areas with specific issues.
3. You Communicate Better

All we are demonstrating here could actually be summed up in one old saying: “a picture is worth a thousand words”. And indeed, you could tell over and over a prospect or an investor how awesome your product and services are, showing them will make it much easier!
Besides, studies found that more of our brain is activated when we listen to stories: providing a good narrative when presenting your data will engage your audience even more. And what better than a comprehensive dataviz to use as an illustration to your data story?
Using data visualization in case-studies, on your blog, in social media, on lead pages, and you will convey your message in a more efficient way than any interesting but long text.
On more team-centric level, you can motivate your colleagues better with visuals. It is easy to lose sight of what we want to achieve when there’s nothing measuring progress. Seeing an actual evolution – good or bad – of your actions and see how they impact the results brings the motivation up and provides key insights on the job they do.
4. Make Quicker And Better Decisions
There is a reason why the dashboard on your car isn’t a spreadsheet telling you about your speed, gas level, or by ranking the damage state of different components with numbers. Speed-o-meters, color-icons and other arrows are simple data visualizations that provide you with crucial information for you to make fast decisions.
Well, the same goes for business dashboards: decision-makers will look at valuable data and understand it much faster than any statistics, and be capable to make quicker and more accurate decisions. In such a fast-paced business environment, where social media rumors or critics spread like wildfire, it is key to be capable to react immediately and adjust the operations and strategy.
A shift in market or consumer habits, sales results below the forecasted trend, or an employee turnover peculiarly high can be detected straight away and respond with an action.
Conclusion
As you can see, data visualizations empower your business in many ways. With a clear and easy way to look into data and interact with it, anyone in the company can take action and make better-informed decisions that will bring value.
Dataviz is a key element of a business’ success in an age of information overload, that let you gain actionable insights to drive your business forward.